
Profile and histogram settings
The edge tools (line, circle, arc, ellipse, polyline, spline), the n cross-sections, the profiles and the histograms share the same settings window. It runs the real instruction at each change: what it shows is exactly what the cycle will do.
Edges along a line
The path is in cyan, the averaged band (span) in yellow. The graph shows the profile and its moving average, then the difference between the averages of the points that follow and those that precede, with the ± M threshold to drag.
The CodOp choices (transition searched for, edges retained) are buttons; the report gives the results P to Y as they will be in the line.
n cross-sections: choosing the section shown
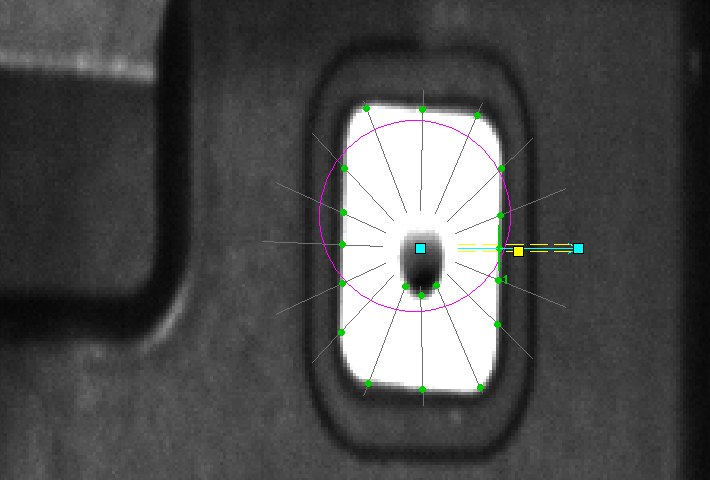
For an arc, a circle or a line by n cross-sections, all the sections are drawn, with their edges and the fitted shape (magenta). The “Coupe” (section) slider chooses the one whose profile is shown.
Profiles and histograms
For a greyscale profile, the graph gives the mean, the median and the extremes along the path, or the distribution of levels. For a histogram, thresholds J and K are dragged over the distribution and the image colours the pixels below J (blue) and above K (red).
The window's help
The “i” badge explains, for each family, how the tool searches: path sampling, moving averages, direction and edges retained.
Good to know
- “Cliquer sur le front voulu” (click the desired edge) sets the threshold between the clicked edge and the strongest spurious edge.
- The profile or the distribution can be exported to CSV.
- Hovering over the graph shows the point on the image, and vice versa.
- Instruction help:
GEOPNC,GEOENC,GEOANC,GEODNC,GEOONC,HISGR,HISGRF,HISGC,HISGA,HISPR.
